Dear tellows friends,
This December, tellows would like to share with you its 2019 study. In which country do you think tellows users were the most active during 2019? In November 2018 we published our first study about the amount of ratings users left on tellows.
We have collected information from January to November 2019 to update you on the latest developments in spam reporting on tellows. Check out the following diagrams to find out about rating trends in your home country, how these have changed compared to last year and how the figures compare to other countries! In the UK, almost 3 in every 1000 site visitors left a comment this year. There was also a mild increase in the total number of comments compared with 2018. Nevertheless, the users of Columbia were the most active with 7 in every 1000 users sharing information about unknown numbers in 2019.
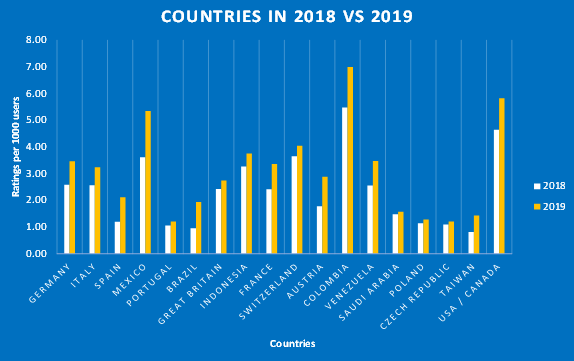
The above graph entitled “Countries in 2018 vs 2019” shows chosen countries from tellows domains on the horizontal axis, while the vertical axis shows the corresponding number of ratings per 1000 users. Each country shows the average number of ratings per 1000 users for 2018 and 2019. In Mexico and Colombia there has been a significant increase in activity with one more rating left for every 1000 users in 2019 compared to 2018. Other countries such as Portugal, Poland and Czech Republic have experienced a slight increase in activity. In general, tellows has seen an increasing concentration of ratings in all countries.
Figures from 2019 show varied amounts of activity
Now let’s compare the 2019 figures alone. The chart below depicts the data from 2019 and classifies the tellows markets using three different colours depending on the amount of ratings per 1000 users. The number of ratings posted per 1000 users ranges from 1 to 8.
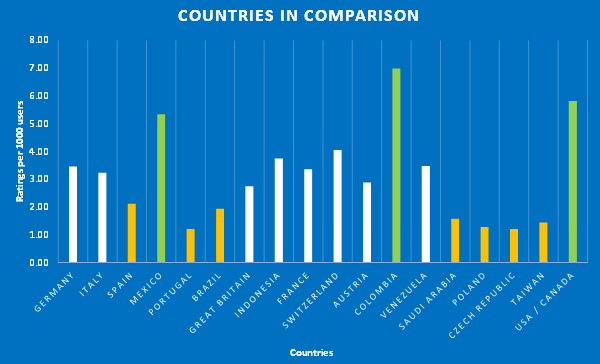
Colombia, the USA / Canada and Mexico had the highest concentration of ratings, with at least 1 rating left per 200 visitors. These countries are marked green in the graph. Columns that are in white include Germany, Italy, the UK, Indonesia, France, Switzerland, Austria and Venezuela. In these countries, the average number of ratings per 1000 users ranged from 3 to 5, which translates to at least 1 rating per 300 users. For others countries such as Spain, Portugal, Brazil, Saudi Arabia, Poland, Czech Republic and Taiwan, the number of ratings per 1000 users was below or equal to 2 – that’s about 1 rating for every 500 users.
Activity: Summarised
To show you the results in more detail, tellows has used the categories from the previous chart to create three different groups that differed in their level of activity. The groups are classified on a scale of 0-6, with a measure of 6 indicating the most activity. Activity refers to the amount of engagement with the tellows website in terms of rating phone numbers. Thus, “Communicative Users” show the highest engagement, “Active Users” report less and can be described as average users. Inactive users report the least. In the diagram below, these countries are marked in orange.
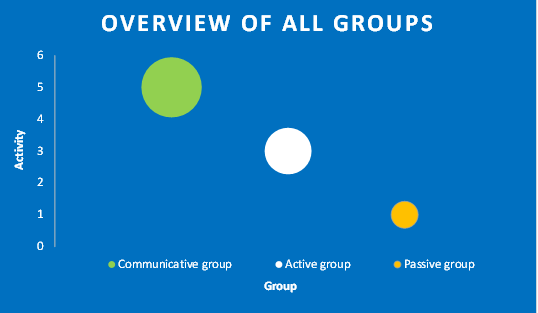
The graph above shows the performance of countries in 2019. Mexico, Columbia and USA/ Canada belong to the communicative group, where users were the most active in reporting numbers. The active group includes Germany, Italy, the UK, Indonesia, France, Switzerland, Austria and Venezuela. These countries are also communicative, as ratings are left regularly. The passive group includes Spain, Portugal, Brazil, Saudi Arabia, Poland, Czech Republic and Taiwan. The willingness to leave a rating on tellows is relatively low and level of activity is below 1.
Mobile users on the increase
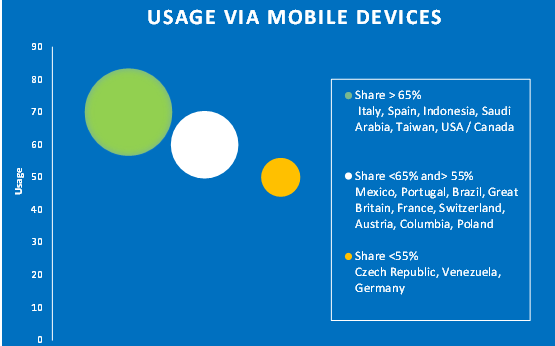
Finally, we also want to show you the usage of tellows’ mobile version in 2019. In the past use of desktop compared to the mobile version of the tellows website was around 50% in most countries. Most users receive spam calls on their mobile devices and look up numbers on their phone. Users from some countries certainly prefer to use mobile for browsing. According to our study, the use of the mobile version of the tellows website in Italy, Spain, Indonesia, Saudi Arabia, Taiwan and USA/ Canada made up over 65%. In comparison, Czech Republic, Venezuela and Germany had a share of mobile usage of lower than 55%. Other countries including Mexico, Portugal, Brazil, the UK, France, Switzerland, Austria, Columbia and Poland had an average mobile version usage of between 55% and 65%.
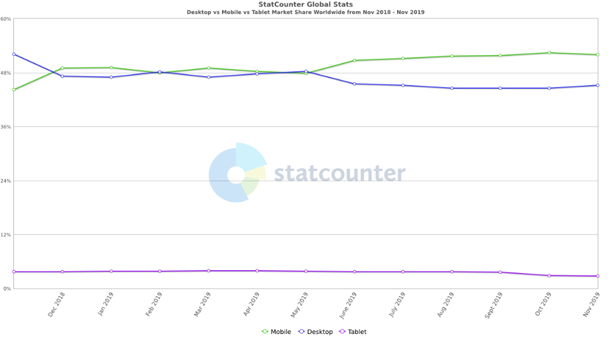
Mobile use of the tellows website has increased in recent years, which is not surprising as according to the Statcounter, more people browsed using their phone instead of desktop in 2019.
We hope you learnt something about the trends of spam calls around the world through reading our study. Install our app to look up unknown numbers instantly for free or visit www.tellows.co.uk.
Your tellows team